IOS에서 Application에서 탈옥을 탐지하기 위해서 사용하는 코드의 예시들을 살펴보겠다.


크게 2가지로 나눌 수 있다.

1. 탈옥시 생기는 경로가 존재하는지 확인해 탐지하는 방법.
2. 탈옥시 생기는 Root 권한으로만 접근할 수 있는 곳에 접근해 탐지하는 방법.

이외에 추가적인 방법이 존재하긴한다. 밑에서 소개하도록 한다.


1. 탈옥시 생기는 경로의 존재여부 검사.

(여러 앱을 분석하면서 검사하는 경로를 추가할 예정이다.)


(fileExistsAtPath: 함수를 통해서 경로의 존재여부를 판단한다.)


(NSArray에 경로들을 쭈욱 넣고 아래와 같은 루틴으로 일치하는게 존재하는지확인한다.)


이와 같이 fopen 함수를 통해서도 판단할 수 있다.


(최신) - *표시한게 현재 내 환경에서 탐지된 경로이다.

/usr/sbin/frida-server 

/etc/apt/sources.list.d/cydia.list  

/etc/apt/sources.list.d/electra.list

/etc/apt/sources.list.d/sileo.sources

/.bootstrapped_electra

/usr/lib/libjailbreak.dylib

/jb/lzma

/.cydia_no_stash 

/.installed_unc0ver 

/jb/offsets.plists

/usr/share/jailbreak/injectme.plist

/etc/apt/undecimus/undecimus.list

/var/lib/dpkg/info/mobilesubstrate.dylib

/Library/MobileSubstrate/MobileSubstrate.dylib

/Library/MobileSubstrate/DynamicLibraries/* 

/jb/jailbreakd.plist

/jb/amfid_payload.dylib

/jb/libjailbreak.dylib

/usr/libexec/cydia/firmware.sh 

/var/lib/cydia/ 

/etc/apt/ 


/private/var/lib/apt/ 

/private/var/Users/

/var/log/apt/ 

/Applications/Cydia.app 

/private/var/stash

/private/var/lib/cydia 

/private/var/cache/apt/ 

/private/var/log/syslog/

/private/var/tmp/cydia.log

/private/var/tmp/frida-*.dylib 

/Applications/Icy.app/

/Applications/MxTube.app/

/Applications/RockApp.app/

/Applications/blackra1n.app/

/Applications/SBSettings.app/

/Applications/FakeCarrier.app/

/Applications/WinterBoard.app/

/Applications/IntelliScreen.app/

/Applications/crackerxi.app/ 

/private/var/mobile/Library/SBSettings/Themes

/Library/MobileSubstrate/CydiaSubstrate.dylib

/System/Library/LaunchDaemons/com.ikey.bbot.plist

/System/Library/LaunchDaemons/com.saurik.Cydia.Startup.plist

/var/mobile/Library/Caches/com.saurik.Cydia/sources.list 


/usr/sbin/sshd 

/usr/bin/sshd

/bin/bash 

/usr/libexec/ssh-keysign 

/usr/libexec/sshd-keygen-wrapper 

/bin/sh 

/etc/alternatives/sh 

/etc/ssh/sshd_confing 

/usr/libexec/sftp-server 

/usr/bin/ssh 


Root 권한으로만 읽기/쓰기를 할 수 있는 곳

(여러 앱을 분석하면서 검사하는 경로를 추가할 예정이다.)


/private/

/root/

/


기타 방법

1. URL을 접속해 에러가 발생하는지 여부를 확인해 탐지하는 방법.

   ( cydia:// 로 시작하는 URL은 탈옥된 디바이스에서만 접속이 된다. )


2. /etc/fstab 의 Size를 통해 탐지하는 방법.


음........ stat로 불러온 객체 +0x60 지점에 뭐가있나..? 80이랑 비교하는데.. 확인해봐야겠다.


3. system(0)을 호출한 결과를 통해 탐지하는 방법.

   ( root권한이 있어야 호출이 가능한 것 같다. )

   이외에도 fork(), vm_protect(), _dyld_image_count() 함수들을 호출함으로써 탐지할 수 있다.

  가 아니라 탈옥기기와 순정기기와의 실행결과가 서로 다르다는 점을 이용해 탈옥여불르 탐지한다.


4. "/Applications"를 lstat의 인자로 전달해 반환 값을 확인한다.

    ( 심볼릭 링크인지 아닌지 확인하는 과정을 거친다.. 무슨...? )


   이외에 확인할 수 있는 경로 목록

    - /Library/Ringtones

    - /Library/Wallpaper

    - /user/arm-apple-darwin9

    - /usr/include

    - /usr/libexec

    - /usr/share


    - /var/lib/undecimus/aat 


기존의 시스템 파티션에 위치하는 몇 개의 디렉토리는 탈옥 과정 파이션이 Overwrite 됨에 따라서 데이터를 더 큰 데이터 파티션에 이전해야 한다. 이전 파일 위치는 유효해야 하므로 심볼 링크를 통해 이를 해결하게된다.


5. 동작중인 프로세스를 점검해 탈옥을 탐지한다.


6. OpenSSH 서비스에 접근함으로써 탐지하는 방법.


'모바일' 카테고리의 다른 글

iOS 디버깅 우회  (0) 2022.05.14
chimera jailbreak download plist  (0) 2022.05.11
[apk-mitm] APK 파일 SSL/TLS pinning 우회 및 기능 없애는 방법 (펌)  (0) 2022.04.28
libil2cpp-Patcher  (0) 2022.04.27
android jadx tool  (0) 2021.12.11
블로그 이미지

wtdsoul

,

iOS 디버깅 우회

모바일 2022. 5. 14. 15:05

https://blog.naver.com/gigs8041/222101950710


[iOS][FRIDA] Anti Debugging Bypass

지난번에 안드로이드 안티 디버깅 우회에 대해서 포스팅한 적이 있다. https://blog.naver.com/gigs8041/22...

blog.naver.com


지난번에 안드로이드 안티 디버깅 우회에 대해서 포스팅한 적이 있다.

https://blog.naver.com/gigs8041/222005876208

이번에는 iOS 안티 디버깅 우회에 대해 포스팅해보려 한다. 동적 디버깅에 사용된 툴은 lldb이고, IDA로 소스 코드 정적 분석을 했다.

예제 앱(DVIA) + 실제 금융 앱에서 사용되고 있는 안티 디버깅 로직은 총 3개였다. (내가 모르는 디버깅 탐지 패턴이 더 있을 수도 있다.)

1. sysctl

2. dlsym + ptrace

3. SVC

사실 세 가지 패턴 모두 코드 패치를 통해 우회한 블로그 포스팅은 많이 보였으나, 프리다를 사용해서 우회했다는 블로그 포스팅은 본 적이 없다. 그래서 구글링 열심히 하면서 디버깅 탐지 로직에 대해 이해하고 프리다 스크립트를 작성해서 안티 디버깅 로직을 우회해봤다.


sysctl 의 경우 attach 는 가능하나 디버깅할 수 없고, ptrace 는 이미 프로세스가 선점되어 있어 attach 조차 불가능하다.

sysctl

ptrace

그럼 위 두 가지 방식의 안티 디버깅 로직을 확인하고 우회해보도록 하겠다.


먼저 sysctl을 사용한 안티 디버깅 로직은 다음과 같다.

sysctl 안티 디버깅 로직

sysctl 함수의 결과 값은 성공 시 0, 실패 시 -1을 반환한다. 여기서 중요한 포인트는 sysctl의 세 번째 인자이다.

sysctl의 세 번째 인자에는 디버깅 플래그 값(P_TRACED)을 담고 있는 구조체의 주소 값이 들어가있다.

구조체의 주소 값에서 플래그 값이 들어가 있는 주소 값 만큼 offset 을 더해주고, 16진수 800과 & 연산을 통해 현재 프로세스가 디버깅 중인지 체크한다.

따라서, 프리다를 통해 위 로직을 우회해보겠다. 우회 스크립트는 다음과 같다.

Interceptor.attach(Module.findExportByName(null, 'sysctl'), { onEnter: function(args) { // console.warn('\t[*] sysctl called !'); this.kp_proc = args[2]; this.count = args[1]; }, onLeave: function(retval) { if(retval == 0x0) { if(this.count.toInt32() == 4) { var p_flag = Memory.readInt(this.kp_proc.add(32)); // console.log(Memory.readByteArray(this.kp_proc.add(32), 2)); if((p_flag & 0x800) !== 0) { console.log('\x1b[34m[!] Anti Debugging Bypass ! (sysctl)\x1b[0m'); Memory.writeByteArray(this.kp_proc.add(32), [0x00, 0x00]); } } } } });

위 스크립트를 실행시킨 뒤 attach를 하면 디버깅이 가능하다.


다음으로 ptrace를 사용하는 안티 디버깅 로직을 우회해보자. 안티 디버깅 로직은 다음과 같다.

ptrace 안티 디버깅 로직

dlsym을 통해 ptrace 함수 주소 값을 가져온 뒤, PT_DENY_ATTACH(31) 플래그 값을 설정해주면 해당 프로세스에 attach 할 수 없다.

해당 로직은 ptrace 함수 후킹 후 첫 번째 인자 변조를 통해 쉽게 우회할 수 있다.

Interceptor.attach(Module.findExportByName(null, 'ptrace'), { onEnter: function(args) { // console.warn('\t[*] ptrace called !'); if(args[0].toInt32() == 31) { console.log('\x1b[34m[!] Anti Debugging Bypass !(ptrace)\x1b[0m'); args[0] = ptr(0x0); } } });

위 스크립트를 실행시키면 ptrace를 통해 디버깅을 탐지하는 로직을 우회할 수 있다.


위 두 가지 스크립트를 모두 작성해서 디버깅을 시도했는데, attach가 되지 않는다면 SVC(Supervisor Call) 를 통해 ptrace를 호출했을 가능성이 크다. SVC를 사용한 안티 디버깅 로직은 다음과 같다.

위 어셈블리어는 syscall(ptrace(31), 0, 0, 0) 과 같다.

E0 03 80 D2 (MOV X0, #0x1F)

01 00 80 D2 (MOV X1, #0)

02 00 80 D2 (MOV X2, #0)

03 00 80 D2 (MOV X3, #0)

50 03 80 D2 (MOV X16, #0x1A)

01 10 00 D4 (SVC 0x80)

ptrace 함수를 사용하는 건 동일하지만, dlsym 으로 호출하는 것이 아닌 SVC 를 통해 호출한다는 점에서 다르다. 그래서 프리다로 ptrace 함수를 후킹해도 후킹되지 않는다.

SVC로 호출한 ptrace 함수를 후킹하는 방법은 메모리 상에서 위 HEX 값을 스캔해서 매핑시킨 뒤, 메모리를 덮어 쓰면 된다.

var m = Process.findModuleByName('ModuleName'); // console.log(JSON.stringify(m)); var pattern = '50 03 80 D2 01 10 00 D4'; // Memory.scanSync(m.base, m.size, pattern); Memory.scan(m.base, m.size, pattern, { onMatch: function(address, size) { // console.log('Memory.scan() found match at ' + address + ' with size ' + size); console.log('\x1b[34m[!] Anti Debugging Bypass ! (SVC ptrace)\x1b[0m'); console.log(Memory.readByteArray(address, size)); Memory.protect(address, size, 'rwx'); Memory.writeByteArray(address.add(4), [0x1F, 0x20, 0x03, 0xD5]); console.warn(Memory.readByteArray(address, size)); }, onComplete: function () { console.log('Memory.scan() complete'); } })

위 스크립트는 앱 최초 실행 시 특정 모듈의 메모리를 스캔해서 syscall ptrace가 매핑되면 SVC 0x80 어셈블리어를 NOP 처리한다.

특정 앱에서 위 스크립트가 적용되지 않는 케이스가 있다. 이럴 때 패턴을 새로 정의해주면 된다.

var pattern = 'E0 03 80 D2 ?? ?? ?? ?? ?? ?? ?? ?? ?? ?? ?? ?? 50 03 80 D2 01 10 00 D4'; ... Memory.scan(m.base, m.size, pattern, { onMatch: function(address, size) { ... Memory.writeByteArray(address, [0x00, 0x00]); ... }, onComplete: function () { ... } })

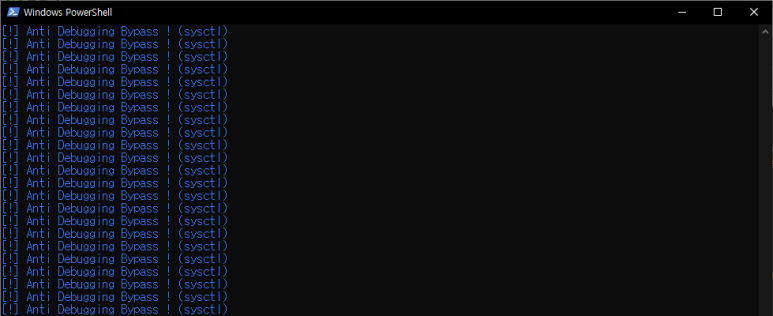
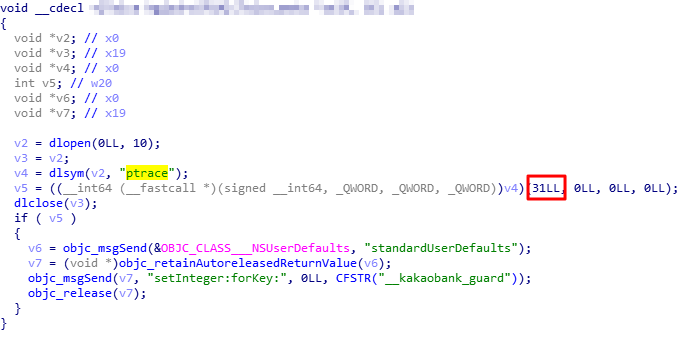
앞서 소개한 세 가지 방법 외에 SVC로 sysctl을 사용하는 경우도 있을 것이고, syscall 이라는 함수를 사용 할 수도 있을 것 같은데, 여러 가지 앱을 분석해보면서 접해보지 않았기 때문에 별도의 스크립트는 작성하지 않았다. 나중에 다른 iOS 안티 디버깅 기술을 찾게 된다면 업데이트 해야겠다.


블로그 이미지

wtdsoul

,

https://yalujailbreak.net/chimera-jailbreak/


Download Chimera jailbreak for iOS 12.0-12.5

Electra Team just released Chimera jailbreak for iPhone XS, XS Max, and XR running iOS 12.0-12.4. Here's how you can download and install it.

yalujailbreak.net

https://ipa-apps.me/


Jailbreak & ++Apps No Jb Or Pc

Watusi Vip | v22.5.71 Watusi / OnlineNotify / WAUnlimitedSend / FilesBackup / WhatsAppFix / DuplicatorStore to active OnlineNotify, you need to enter any email,pass then login will be Successful.

ipa-apps.me


'모바일' 카테고리의 다른 글

[IOS] 탈옥 탐지(Jailbreak) 코드 예시.  (0) 2022.10.21
iOS 디버깅 우회  (0) 2022.05.14
[apk-mitm] APK 파일 SSL/TLS pinning 우회 및 기능 없애는 방법 (펌)  (0) 2022.04.28
libil2cpp-Patcher  (0) 2022.04.27
android jadx tool  (0) 2021.12.11
블로그 이미지

wtdsoul

,

https://domdom.tistory.com/entry/apk-mitm-APK-%ED%8C%8C%EC%9D%BC-SSLTLS-pinning-%EC%9A%B0%ED%9A%8C-%EB%B0%8F-%EA%B8%B0%EB%8A%A5-%EC%97%86%EC%95%A0%EB%8A%94-%EB%B0%A9%EB%B2%95?category=977716


[apk-mitm] APK 파일 SSL/TLS pinning 우회 및 기능 없애는 방법

아마 SSL/TLS(인증서) Pinning 방식은 Android 7 부터 안드로이드 개발자들이 MITM(Man-in-the-middle) 공격을 막기 위해서 만들었을 겁니다. 그리고 보통 SSL/TLS Pinning 우회를 하는 이유는 모바일 앱에서 Netw..

domdom.tistory.com


'모바일' 카테고리의 다른 글

iOS 디버깅 우회  (0) 2022.05.14
chimera jailbreak download plist  (0) 2022.05.11
libil2cpp-Patcher  (0) 2022.04.27
android jadx tool  (0) 2021.12.11
dex2jar 에러 경로 참고  (0) 2021.12.11
블로그 이미지

wtdsoul

,

libil2cpp-Patcher

모바일 2022. 4. 27. 17:12

https://github.com/T5ive/libil2cpp-Patcher 


GitHub - T5ive/libil2cpp-Patcher: Easy to mod il2cpp (just a simple hex edit)

Easy to mod il2cpp (just a simple hex edit). Contribute to T5ive/libil2cpp-Patcher development by creating an account on GitHub.

github.com


블로그 이미지

wtdsoul

,

android jadx tool

모바일 2021. 12. 11. 00:25

https://dev-huhu.tistory.com/27


[Android] 안드로이드 APK 분석 툴(디컴파일) jadx

과거 APK 디컴파일을 위해 무슨 과정을 많이 거쳤는데 classes.dex 파일을 어떻게 jar로 변환하는지? 폴더 구조는 보이지만 파일의 코드를 전혀 볼 수 없었는지? 등의 문제를 거치다가 그 모든 과정을

dev-huhu.tistory.com

https://github.com/skylot/jadx/releases/tag/v1.3.0


Release 1.3.0 · skylot/jadx

Core Initial support for 'invoke-custom' instruction (#384) Initial support for java bytecode decompilation Concat constant strings (#1014) Rewrite try-catch processing Support AAR files as input ...

github.com


블로그 이미지

wtdsoul

,

https://blog.daum.net/gomahaera/23


[안드로이드] dex2jar : DexException not support version

proguard가 잘 적용이 되었는지 확인해보기 위해 디컴파일을 하려는데 dex파일을 jar 파일로 변환조차 안된다..ㅋ dex2jar 파일이 매년 업데이트가 되는게 아닌듯.. sourceforge에서 최신 업데이트가 16년

blog.daum.net


proguard가 잘 적용이 되었는지 확인해보기 위해 디컴파일을 하려는데 dex파일을 jar 파일로 변환조차 안된다..ㅋ

dex2jar 파일이 매년 업데이트가 되는게 아닌듯.. sourceforge에서 최신 업데이트가 16년에 이뤄졌...


암튼 이런 에러가 나면 classes.dex 파일을 열어서 한곳만 수정해주면 바로 jar 파일을 만들 수 있다!

hex editor를 먼저 다운로드 받아서 classes.dex 파일을 연다. (참고로 hex editor neo를 사용함)

www.hhdsoftware.com/free-hex-editor


Free Hex Editor: Fastest Binary File Editing Software. Freeware. Windows

I have been using Free Hex Editor Neo for years now for my hobby projects. Mostly in microcontroller debugging, where I was analyzing the buffer content or change endiannes of the data block. Lately I started with sd card driver for mcu and I had to analyz

www.hhdsoftware.com

열때, View-Offset-Decimal로 하고 보면 편하다... 한참 헤맴 ㅋ


파일을 열면 아래와 같이 나온다.

사진에서 초록색 칸으로 색칠되어 있는 이 부분! 여기 값이 35보다 크면 not support version 에러가 난다.. 싸발적..

그러니 이 값이 37 혹은 38인 경우 35로 고쳐서 저장해주자!

색칠되어 있는 칸이 안드로이드 버전을 나타냄


고치고 나면 저장해주고!

cmd 창 열어서 dex->jar 로 파일을 변환해주고! (cmd 명령어: d2j-dex2jar classes.dex)

jd-gui로 확인해보자~! 끝!


[참고 사이트]

www.programmersought.com/article/6193889467/


Dex2jar error com.googlecode.d2j.DexException: not support version - Programmer Sought

Reference link: https://www.jianshu.com/p/55bf5f688e9a https://source.android.com/devices/tech/dalvik/dex-format#dex-file-magic the reason: The version of dex2jar does not match the version of the dex file to be parsed. Program: Use the corresponding versi

www.programmersought.com


'모바일' 카테고리의 다른 글

libil2cpp-Patcher  (0) 2022.04.27
android jadx tool  (0) 2021.12.11
모바일 원격 디버깅 대응 소스 코드  (0) 2021.08.31
LLDB 디버깅 명령어 건  (0) 2021.08.31
딥링크란??  (0) 2021.08.03
블로그 이미지

wtdsoul

,

 보안설정방법
해당 프로세스가 디버거에 의해 제어 받고 있는지 확인하고 탐지, 종료하는 루틴을 삽입하여 해당 프로세스를 강제 종료시켜야 함(한가지 방식 적용이 아닌 아래의 방식을 모두 적용하여 프로세스 실행 중 주기적인 검증 수행 필요)
 
<Android>
소스 구현 영역에 따라 SDK(Java)와 NDK(C, Natice)로 구현 가능함.

<참고. SDK Java 소스 구현 방안>
[구현 방안 1 : 디버그 프로세스 탐지]
static int detect_isDebuggerPresent(){
     if(Debug.isDebuggerConnected())
          return 1;
     else return 0;
}


[구현 방안 2 : 디버깅 시 브레이크 포인트가 걸리는 시간 측정]
static boolean detect_threadCpuTimeNanos () {
long start = Debug.threadCpuTimeNanos ();
for(int i = 0; i <1000000; ++i )
continue;
long stop = Debug.threadCpuTimeNanos();
if(stop - start < 10000000)
return false ;
else
return true ;
}


<참고. NDK C 소스 구현 방안>
구현 방안 1 : 디버그 프로세스 탐지]
JNIEXPORT jboolean JNICALL Java_poc_c_detectdebuggerConnected (JNIEnv* env,jobject dontuse)
if(gDvm.debuggerConnected || gDvm.debuggerActive){
           return JNI_TRUE ;
     return JNI_FALSE ;
 }

[구현 방안 2 : process status 파일 확인]
#ifndef JNI_ANDROID_ANTI_DEBUG_H_
#define JNI_ANDROID_ANTI_DEBUG_H_

#include <jni.h>
#ifdef __cplusplus
extern "C" {
#endif
#ifdef __cplusplus
}
#endif

#endif /* JNI_ANDROID_ANTI_DEBUG_H_ */
#include <android/log.h>
#include <jni.h>
#include <string>
#include <sys/ptrace.h>
#include <unistd.h>
#include <stdlib.h>
#include <chrono>
#include <thread>

void be_attached_check()
{
    try
    {
        const int bufsize = 1024;
        char filename[bufsize];
        char line[bufsize];
        int pid = getpid();
        sprintf(filename, "/proc/%d/status", pid);
        FILE* fd = fopen(filename, "r");
        if (fd != nullptr)
        {
            while (fgets(line, bufsize, fd))
            {
                if (strncmp(line, "TracerPid", 9) == 0)
                {
                    int statue = atoi(&line[10]);
                    LOGD("%s", line);
                    if (statue != 0)
                    {
                        LOGD("be attached !! kill %d", pid);
                        fclose(fd);
                        int ret = kill(pid, SIGKILL);
                    }
                    break;
                }
            }
            fclose(fd);
        } else
        {
            LOGD("open %s fail...", filename);
        }
    } catch (...)
    {

    }

}
void thread_task(int n)
{
    while (true)
    {
        LOGD("start be_attached_check...");
        be_attached_check();
        std::this_thread::sleep_for(std::chrono::seconds(n));
    }
}
void anti_debug()
{
    LOGD("call anti_debug ......");
    auto checkThread = std::thread(thread_task, 1);
    checkThread.detach();
}

jint JNI_OnLoad(JavaVM* vm, void* reserved)
{
    anti_debug();
    JNIEnv* env;
    if (vm->GetEnv(reinterpret_cast<void**>(&env), JNI_VERSION_1_6) != JNI_OK)
    {
        return -1;
    }
    return JNI_VERSION_1_6;
}

[구현 방안 3 : ptrace 선점을 통한 디버거process attach 방지]

#include <jni.h>
#include <unistd.h>
#include <sys/ptrace.h>
#include <sys/wait.h>
#include <pthread.h>

static int child_pid;
void * monitor_pid(void *pVoid) {
    int status;
    waitpid(child_pid, &status, 0);
    /* Child status should never change. */
    _exit(0); // Commit seppuku
}

void anti_debug() {
    child_pid = fork();
    if (child_pid == 0)
    {
        int ppid = getppid();
        int status;
        if (ptrace(PTRACE_ATTACH, ppid, NULL, NULL) == 0)
        {
            waitpid(ppid, &status, 0);
            ptrace(PTRACE_CONT, ppid, NULL, NULL);
            while (waitpid(ppid, &status, 0)) {
                if (WIFSTOPPED(status)) {
                    ptrace(PTRACE_CONT, ppid, NULL, NULL);
                } else {
                    // Process has exited
                    _exit(0);
                }
            }
        }

    } else {
        pthread_t t;
        /* Start the monitoring thread */
        pthread_create(&t, NULL, monitor_pid, (void *)NULL);
    }
}

JNIEXPORT void JNICALL
Java_sg_vantagepoint_antidebug_MainActivity_antidebug(JNIEnv *env, jobject instance) {
    anti_debug();
}

<iOS>
아래는 프로그램이 디버거로 제어를 받고 있는지 탐지, 종료하는 예제코드임.

<참고. 구현 방안>
[구현 방안 1]
//  main.m
//  ProtectionSample
#import <Cocoa/Cocoa.h>
#include <sys/ptrace.h>

int main(int argc, char *argv[])
{
    //Build settings -> Other C Flags: -DDEBUG
#ifdef DEBUG
    //do nothing
#else
    ptrace(PT_DENY_ATTACH, 0, 0, 0);
#endif
    return NSApplicationMain(argc,  (const char **) argv);

[구현 방안 2]
#import <dlfcn.h>
#import <sys/types.h>

typedef int (*ptrace_ptr_t)(int _request, pid_t _pid, caddr_t _addr, int _data);
#if !defined(PT_DENY_ATTACH)
#define PT_DENY_ATTACH 31
#endif  // !defined(PT_DENY_ATTACH)
void disable_gdb() {
void* handle = dlopen(0, RTLD_GLOBAL | RTLD_NOW);
ptrace_ptr_t ptrace_ptr = dlsym(handle, "ptrace");
ptrace_ptr(PT_DENY_ATTACH, 0, 0, 0);
dlclose(handle);
}

[방안 3 : 파일 변경 확인 또는 디버거에 의한 실행 확인 방법]
NSString* bundlePath = [[NSBundle mainBundle] bundlePath];
NSString* path = [NSString stringWithFormat:@"%@/Info.plist", bundlePath];
NSString* path2 = [NSString stringWithFormat:@"%@/AppName", bundlePath];
NSDate* infoModifiedDate = [[[NSFileManager defaultManager] fileAttributesAtPath:path traverseLink:YES] fileModificationDate];
NSDate* infoModifiedDate2 = [[[NSFileManager defaultManager] fileAttributesAtPath:path2 traverseLink:YES] fileModificationDate];
NSDate* pkgInfoModifiedDate = [[[NSFileManager defaultManager] fileAttributesAtPath:[[[NSBundle mainBundle] resourcePath] 
stringByAppendingPathComponent:@"PkgInfo"] traverseLink:YES] fileModificationDate];
if([infoModifiedDate timeIntervalSinceReferenceDate] > [pkgInfoModifiedDate timeIntervalSinceReferenceDate]) {  
//파일 변경
}
if([infoModifiedDate2 timeIntervalSinceReferenceDate] > [pkgInfoModifiedDate timeIntervalSinceReferenceDate]) { 
//파일변경
}

'모바일' 카테고리의 다른 글

android jadx tool  (0) 2021.12.11
dex2jar 에러 경로 참고  (0) 2021.12.11
LLDB 디버깅 명령어 건  (0) 2021.08.31
딥링크란??  (0) 2021.08.03
3utools GPS 변경 건  (0) 2021.07.02
블로그 이미지

wtdsoul

,

https://minsone.github.io/ios/mac/xcode-lldb-debugging-with-xcode-and-lldb


[Xcode][LLDB]Debugging With Xcode and LLDB

iOS 개발을 좀 더 잘하기 위해, 편하게 버그를 추적하기 위해 LLDB를 이용한 디버깅 방법을 기록합니다. Thread의 Stack, Frame Thread가 생겨날 때, 해당 Thread를 위한 Stack이 만들어지며, 해당 Stack에는 Fram

minsone.github.io


iOS 개발을 좀 더 잘하기 위해, 편하게 버그를 추적하기 위해 LLDB를 이용한 디버깅 방법을 기록합니다.

Thread의 Stack, Frame

Thread가 생겨날 때, 해당 Thread를 위한 Stack이 만들어지며, 해당 Stack에는 Frame이 들어갑니다.

Execution Commands

  • Continue - 정지된 프로그램 실행을 재개함.

(lldb) continue (lldb) c

  • Step Over - 현재 선택된 Frame에서 소스 수준의 한 단계를 진행.

(lldb) thread step-over (lldb) next (lldb) n

  • Step Into - 현재 선택된 Frame에서 소스 수준의 한 단계 안으로 들어감.

(lldb) thread step-in (lldb) step (lldb) s

  • Step Out - 현재 선택된 Frame에서 벗어남.

(lldb) thread step-out (lldb) finish

  • Instruction Level Step Into - 현재 선택된 Frame에서 명령어 수준의 한 단계 안으로 들어감.

(lldb) thread step-inst (lldb) si

  • Instruction Level Step Over - 현재 선택된 Frame에서 명령어 수준의 한 단계를 진행.

(lldb) thread step-inst-over (lldb) ni

Examining Variables - 변수 검사

  • Frame Variable - 메모리에서 변수를 읽어 lldb 형태의 description을 출력함.

/// 현재 frame에 argument와 local 변수 출력하기. (lldb) frame variable (lldb) fr v /// 현재 frame에 local 변수 출력하기 (lldb) frame variable --no-args (lldb) fr v -a /// local 변수 `bar` 내용 출력하기 (lldb) frame variable bar (lldb) fr v bar /// local 변수 `bar`을 hex로 내용 출력하기 (lldb) frame variable --format x bar (lldb) fr v -f x bar /// Object의 Description 출력하기 (lldb) frame variable -O self

  • Target Variable - global/static 변수를 출력함.

/// global 변수 `baz` 내용 출력하기 (lldb) target variable baz (lldb) ta v baz /// 현재 소스 파일에서 정의된 global/static 변수 출력하기 (lldb) target variable (lldb) ta v

  • Target Stop-hook / Display - 매번 멈출 때 마다 지정된 명령 실행 / 멈출 때 마다 지정한 변수 내용을 출력

/// `frame variable argc argv` stop hook을 등록하기 (lldb) target stop-hook add --one-liner "frame variable argc argv" (lldb) ta st a -o "fr v argc argv" /// 멈출 때 마다 argc, argv 내용을 출력하기 (lldb) display argc (lldb) display argv /// `main` 함수 안에서 멈추면 argc, argv 내용을 출력하기 (lldb) target stop-hook add --name main --one-liner "frame variable argc argv" (lldb) ta st a -n main -o "fr v argc argv" /// C 클래스 이름인 MyClass 안에서 멈추면 *this 변수 내용을 출력하기 (lldb) target stop-hook add --classname MyClass --one-liner "frame variable *this" (lldb) ta st a -c MyClass -o "fr v *this" /// Multiple Line Hook (lldb) target stop-hook add > bt > disassemble --pc > DONE

Examining Thread State - 스레드 상태 검사

  • Thread List/Change - 현재 스레드 목록을 보여줌 / 다른 스레드로 이동하기

/// 현재 스레드 목록을 보여주기 (lldb) thread list /// Thread 2로 이동하기 (lldb) thread select 2

  • Thread Until/Jump/Return - 특정 줄 전까지 실행 후 멈춤 / 특정 주소/줄로 이동 / 현재 stack frame에서 특정 값을 반환(note: Swift에서는 거의 안됨)

/// 특정 줄까지 step over 수행함.(ex: 현재 줄이 10줄이고, 20 이전 까지 step over를 수행함.) (lldb) thread until 20 // 19줄까지 step over, 20줄에서 멈춤 /// 특정 frame의 특정 소스 줄까지 수행함.(frame 2에서 10번째 까지 수행) (lldb) thread until --frame 2 10 /// 명령어 수준의 특정 주소까지 수행함 (lldb) disassemble --frame (lldb) thread until --address 0x1023653a0 /// 특정 소스라인까지 이동함. (lldb) thread jump --line 10 // 10번째 줄으로 이동 (lldb) thread jump --by 5 // 현재 줄에서 +5번째 줄로 이동 (lldb) thread jump --by -5 // 현재 줄에서 -5번째 줄로 이동 /// 현재 frame에서 Void를 반환하거나 특정 값을 반환 (lldb) thread return (lldb) thread return 0 (lldb) thread return "aa" // Only Objc error: Error returning from frame 0 of thread 1: We only support setting simple integer and float return types at present..

  • Disassemble

/// 현재 frame의 현재 함수를 disassemble하여 보여줌. (lldb) disassemble --frame (lldb) di -f /// main 이라는 함수를 disassemble하여 보여줌. (lldb) disassemble --name main (lldb) di -n main /// 지정된 주소범위의 명령어 코드를 출력함. (lldb) disassemble --start-address 0x1eb8 --end-address 0x1ec3 (lldb) di -s 0x1eb8 -e 0x1ec3 /// 시작 주소부터 20개의 명령어를 출력함. (lldb) disassemble --start-address 0x1eb8 --count 20 (lldb) di -s 0x1eb8 -c 20 /// 현재 frame의 코드에 해당하는 명령어를 코드와 같이 출력함. (lldb) disassemble --frame --mixed (lldb) di -f -m /// 현재 frame에 현재 소스 코드 라인을 disassemble하여 보여줌. (lldb) disassemble --line (lldb) di -l

  • Backtrace - 스레드의 stack backtrace를 보여줌.

/// 현재 스레드의 stack backtrace를 보여주기 (lldb) thread backtrace (lldb) bt /// 모든 스레드의 stack backtrace를 보여주기 (lldb) thread backtrace all (lldb) bt all /// 현재 스레드의 frame에서 1~5번 backtrace를 보여주기 (lldb) thread backtrace -c 5 (lldb) bt 5 /// 현재 스레드에서 특정 stack frame index를 선택하기 (lldb) frame select 12 (lldb) fr s 12 (lldb) f 12 /// 현재 스레드에서 현재 선택된 frame의 정보 출력하기 (lldb) frame info (lldb) fr info /// 현재 선택된 stack frame에서 아래로 이동 (lldb) up (lldb) up 3 (lldb) down (lldb) down 5

Evaluating Expression - 표현식 계산하기

  • 현재 frame에서 표현식 계산하기

(lldb) expression print(1 + 2) (lldb) expr print(1 + 2) (lldb) e print(1 + 2) (lldb) expression -- print(1 + 2) (lldb) print print(1 + 2) (lldb) p print(1 + 2)

  • LLDB에서 변수를 선언하기

(lldb) expr var $foo = 10 (lldb) expr print($foo) // Output: 10 (lldb) expr $foo += 1 (lldb) expr print($foo) // Output: 11

  • Objc 객체의 description 보여주기

(lldb) expr --object-description -- object (lldb) expr -o -- object (lldb) po object

  • 특정 메모리 주소의 값을 출력하기

/// Swift (lldb) expr -l swift -- import UIKit (lldb) expr -l swift -- let $vc = unsafeBitCast(0x7fe75a70bb40, to: ViewController.self) (lldb) po $vc /// Objc (lldb) expr -l objc -- @import UIKit (lldb) expr -l objc -- ViewController *$vc = (ViewController *)0x7fe75a70bb40 (lldb) po $vc /// 실행 중에 Pause를 한 후, 특정 메모리 주소의 값을 확인하는 경우 (lldb) expr -l Swift -- Enter expressions, then terminate with an empty line to evaluate: 1 let $vc = unsafeBitCast(0x7fe75a70bb40, to: ViewController.self) 2 print($vc) 3 /// 위 명령들을 축약 (lldb) expr import UIKit (lldb) p import UIKit (lldb) expr let $vc = unsafeBitCast(0x7fe75a70bb40, to: ViewController.self) (lldb) po $vc <SomeProject.ViewController: 0x7fe75a70bb40>

  • 임의의 UIViewController 생성하여 NavigationViewController에 Push하기

(lldb) expr var $vc = UIViewController() (lldb) expr $vc.view.backgroundColor = UIColor.red (lldb) expr self.navigationController?.pushViewController($vc, animated: true)

  • Printing Modes
    • frame variable (fr v) - Code를 실행하지 않으며, LLDB formatter를 사용
    • expression -- (p) - Code를 실행하며, LLDB formatter를 사용
    • expression -O -- (po) - Code를 실행하며, debugDescription와 같이 개발자가 만든 출력 형태를 사용
  • BreakPoint 설정된 코드를 실행시 Pause되도록 하기

(lldb) expr --ignore-breakpoints false -- <Expression>

  • 메소드 및 클래스 선언하기

특정한 메소드 및 클래스를 만들어 사용할 수 있습니다.

(lldb) po Enter expressions, then terminate with an empty line to evaluate: 1 class $A { 2 var $b = 0 3 } 4 (lldb) po $A() <$A: 0x600001bc87e0> (lldb) po $A().$b 0

또한, Extension에 함수를 만들어 사용할 수 있습니다.

(lldb) po Enter expressions, then terminate with an empty line to evaluate: 1 extension ViewController { 2 func $changeBgColor() { 3 self.view.backgroundColor = .red 4 } 5 } 6 (lldb) po self.$changeBgColor()

BreakPoint - BreakPoint 설정하기

/// viewDidLoad 이름인 모든 함수에 breakpoint를 설정하기 - Swift (lldb) breakpoint set --name viewDidLoad (lldb) br s -n viewDidLoad (lldb) b viewDidLoad /// viewDidLoad 이름인 모든 함수에 breakpoint를 설정하기 - Objc (lldb) breakpoint set --name "-[UIViewController viewDidLoad]" /// 특정 파일 특정 줄에 breakpoint 설정하기 (lldb) breakpoint set --file test.c --line 12 (lldb) br s -f test.c -l 12 (lldb) b test.c:12 /// 현재 파일의 특정 줄에 breakpoint 설정하기 (lldb) breakpoint set --line 12 (lldb) br s -l 12 (lldb) b 12 /// 특정 이름을 가진 Select에 breakpoint 설정하기 (lldb) breakpoint set --selector dealloc /// breakpoint에 global이 5이면 중단되도록 조건 설정 (lldb) b 12 (lldb) breakpoint modify -c "global == 5" /// breakpoint 목록 보기 (lldb) breakpoint list (lldb) br l /// breakpoint 지우기 (lldb) breakpoint delete 1 (lldb) br del 1

Watchpoint - 변수에 값이 기록될 때마다 중단되도록 설정

/// 전역 변수에 watchpoint 설정 (lldb) watchpoint set variable global_var (lldb) wa s v global_var /// 메모리 주소에 watchpoint 설정 (lldb) watchpoint set expression -- my_ptr (lldb) wa s e -- my_ptr /// watchpoint에 global이 5이면 중단되도록 조건 설정 (lldb) watch set var global (lldb) watchpoint modify -c "global == 5" /// watchpoint 목록 보기 (lldb) watchpoint list (lldb) watch l /// watchpoint 지우기 (lldb) watchpoint delete 1 (lldb) watch del 1

Script - Python REPL

  • Python을 LLDB Script로 사용할 수 있음.

(lldb) script print 1 + 2 // Output: 3 (lldb) script import os (lldb) script print os.getcwd()

  • import - 필요한 script 소스를 import하여 사용함.

(lldb) command script import ~/myCommands.py

또는 /.lldbinit 파일 내에 command script import ~/myCommands.py 를 추가함.

기타

/// 특정 키워드의 상세한 설명을 보여줌 (lldb) apropos keyword /// 기본 언어 설정을 바꿈 (lldb) settings set target.language swift /// Alias 설정 (lldb) command alias es expression -l swift --

LLDB 확장 툴

  • Chisel - python으로 대부분 작성되어 있으며, View Debugging 관련하여 손쉽게 사용할 수 있도록 도와주며, 여기에서 많은 명령을 살펴볼 수 있음.
  • DerekSelander - LLDB - A collection of LLDB aliases/regexes and Python scripts to aid in your debugging sessions

참고자료

'모바일' 카테고리의 다른 글

dex2jar 에러 경로 참고  (0) 2021.12.11
모바일 원격 디버깅 대응 소스 코드  (0) 2021.08.31
딥링크란??  (0) 2021.08.03
3utools GPS 변경 건  (0) 2021.07.02
3utools connected error 건  (0) 2021.04.22
블로그 이미지

wtdsoul

,

딥링크란??

모바일 2021. 8. 3. 13:47

https://www.adjust.com/ko/blog/dive-into-deeplinking/


모바일 앱 딥링크 완전 정복 가이드 | Adjust

까다로운 딥 링킹을 Adjust가 도와드립니다. Universal link 및 딥링크 구현에 대해 알아 보려면 가이드를 살펴보세요.

www.adjust.com


'모바일' 카테고리의 다른 글

모바일 원격 디버깅 대응 소스 코드  (0) 2021.08.31
LLDB 디버깅 명령어 건  (0) 2021.08.31
3utools GPS 변경 건  (0) 2021.07.02
3utools connected error 건  (0) 2021.04.22
apple file conduit 2 (내부 폴더 확인)  (0) 2021.03.25
블로그 이미지

wtdsoul

,